
Dashboards and data analysis
The data already exists. It just needs turning into decisions.
Reliable indicators from the sources you already have, in dashboards that management actually uses.
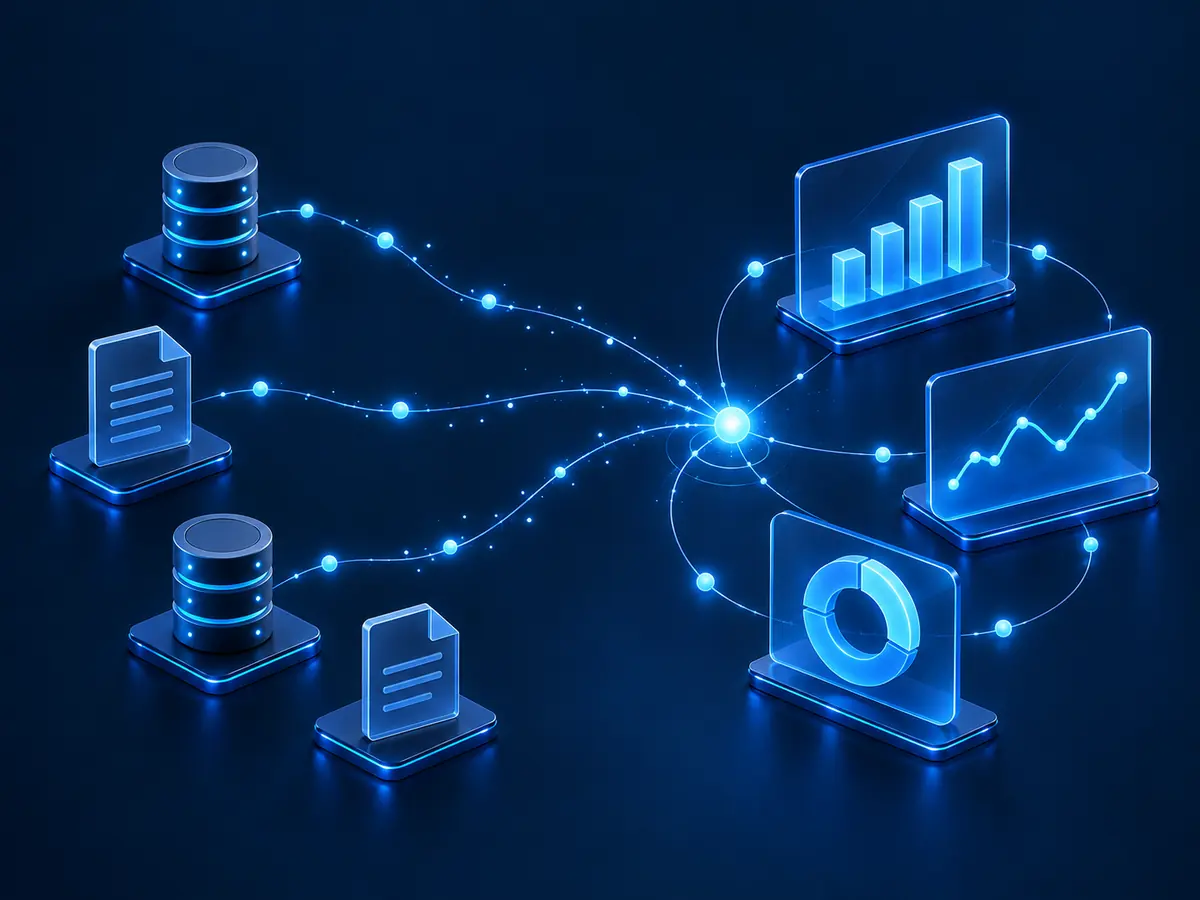
We connect to the sources that already exist, ERP, spreadsheets, databases and third-party systems, and build a coherent data model, with the same definition of every number across the whole company.
The goal is not more charts. It is fewer meetings arguing over whose number is right.
What it includes
- Data integration and cleaning
- Business indicators with a single definition
- Operational and management dashboards
- Automatic reports by email
Where it fits in the method
The dashboards are Tailored Dev applications: light, connected to the sources, with no per-user licences.
Phase 02 · Tailored DevSGIT
Where it lives in SGIT
SGIT is the integrated management system every client has in the client area. This is where this service is recorded:

Projects and tasks
Status, deadlines, hours and progress for every project, with its tasks and Gantt chart.

Feature tracking
Improvement requests for your applications, from idea to delivery, with the status and expected date of each one.
The images show the demo company ACME, with fictitious data.
Other services
Cloud migration
We assess what should go, design the architecture and migrate servers, files and applications with a rollback plan.
Learn more Tailored DevMoving back from the cloud to your own servers
We bring back to your own servers the workloads that are cheaper and more predictable in house.
Learn more Tailored DevMicrosoft 365 implementation and adoption
Email and file migration, Teams and SharePoint, security, and then training and follow-up until the tool is adopted.
Learn moreNeed technology made to measure?
A thirty-minute conversation is usually enough to see whether we are the right fit for you.